
It’s been quite a while since I’ve updated this website (and blog), but I suppose there’s
no better excuse than a pandemic to find new hobbies and restart old projects. Since I first shared the educational materials on this site, I’ve (apparently) been grad school for over 2 years and, as part of my candidacy requirements, have the great burden opportunity to dig into an area of interest. I hope that the act of writing a blog post will help me organize my thoughts and inch closer to what it precisely is that I am interested in researching, and serve dual purpose as a time capsule of my personal and professional thoughts.
Now with that complete, I’ll move on to our main motivation: synthesizing knowledge regarding metacognition, in which the current pandemic will serve as a backdrop for this discussion about how people think and how we teach people to think. But, cognition and metacognition can (obviously) relate to many more things beyond what is discussed here. Roughly 3 months ago, when much of the lockdowns were first imposed, a friend and I were discussing the diagram below:
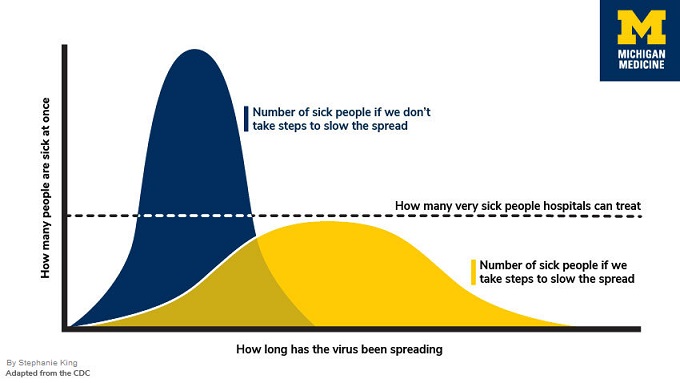
While there are many non-Michigan-branded varieties of this plot, the general phrase “flattening the curve” should be familiar to most. I recall my colleague mentioning how elegant and simple this picture was and how it was difficult to fathom how people couldn’t understand the urgency of the situation. Yet, if we dissect this piece-by-piece, it’s actually a lot of knowledge packed into an “accessible-looking” figure, and a fun exercise in avoiding the “expert blind spot” [1], otherwise known as that feeling when you’re in class and the instructors’ explanation goes over everyone’s head, or when a textbook says “the proof is left to the reader (or is evident)” and the reader has no idea how to connect the dots.
For starters, comprehending this figure requires one to have basic mastery of knowledge components regarding reading graphs. This means looking at the x-axis and understanding that it is temporal, that the y-axis is the number of people sick at any given time, while also realizing that the exact dates are not relevant for the main idea this diagram is trying to convey. Then, we must know that the 2 overlaid curves involve 2 different scenarios: one with preventative measures and one without. Finally, the horizontal line represents the capacity a hospital can treat at any given time and that this is fixed, at least in this representation (more on that later).
We must utilize knowledge, which I’ll loosely define as “information about things or processes,” and cognition [2], which is an umbrella term that includes thinking and all the mental processes that help us collect, maintain, create, and make sense or use of knowledge . You might be familiar with Bloom’s taxonomy [3] for instance, which is a rough hierarchy (the upper two tiers are perhaps more or less on the same level) of educational objectives. The updated version published in 2001 [4] incorporates knowledge and cognition as its own dimensions and is shown in the picture below:
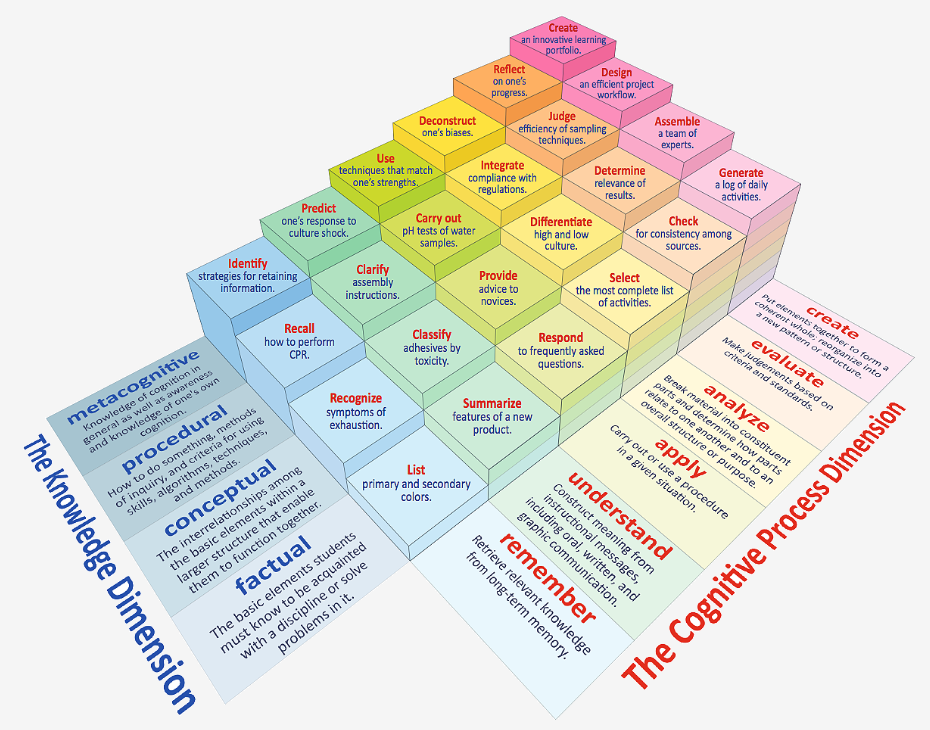
So, in the example above, we have mainly focused on “remembering” and “understanding”, and even then there are quite a few moving gears, before accounting for analysis and evaluation. To dive deeper into what I mean, the “number of sick people” is actually rather difficult to understand as this is represented by the area under the curve, or a sum of the number of people sick captured across a series of time slices (yay calculus!). Assuming all that registers, we might then ask questions such as whether or not the total number of infected people will decrease as a result of preventative measures, or remain stable with cases simply spread over time to avoid overloading hospital capacity.
One might even begin to “evaluate” the model and ask if the capacity is truly fixed. More health care workers might become sick as there are more patients, or more temporary facilities may be constructed which might yield a slight boost and morph the horizontal threshold. All of this only scratches the surface regarding societal consequences (e.g. how overloaded hospitals affects treatment of other ailments, weighing who gets treatment, anticipating public response, etc.). Even then, one can argue about which of these nuances are significant enough to warrant the added complexity in our model.
As I’ve shown, even if we can identify individual components (not moving past the second level of the taxonomy), it can still be hard to really understand the full picture. This is especially difficult if someone already has a preconceived hypothesis or conclusion in mind. Thus, having an informed opinion requires us to judge our own understanding, identify this gap in knowledge (and it’s sometimes hard to know what you don’t know!), figure out when and where to fill this gap, have the strategies to learn from other sources, and actually muster up the motivation to set these plans in motion. In other words, knowing and thinking alone are often not enough; we need “thinking about thinking,” or in other words, metacognition. To end, feel free to explore some of the ideas here with a cellular automata epidemic simulation and an exploratory analysis video as well.