An NSF GRFP Retrospective
The National Science Foundation (NSF) has a Graduate Research Fellowship Program (GRFP) that hands out awards to graduate students each year. I received this after applying for it in my first year of the PhD program. Here is a short description directly from their website:

First Time Teaching an Undergraduate Course
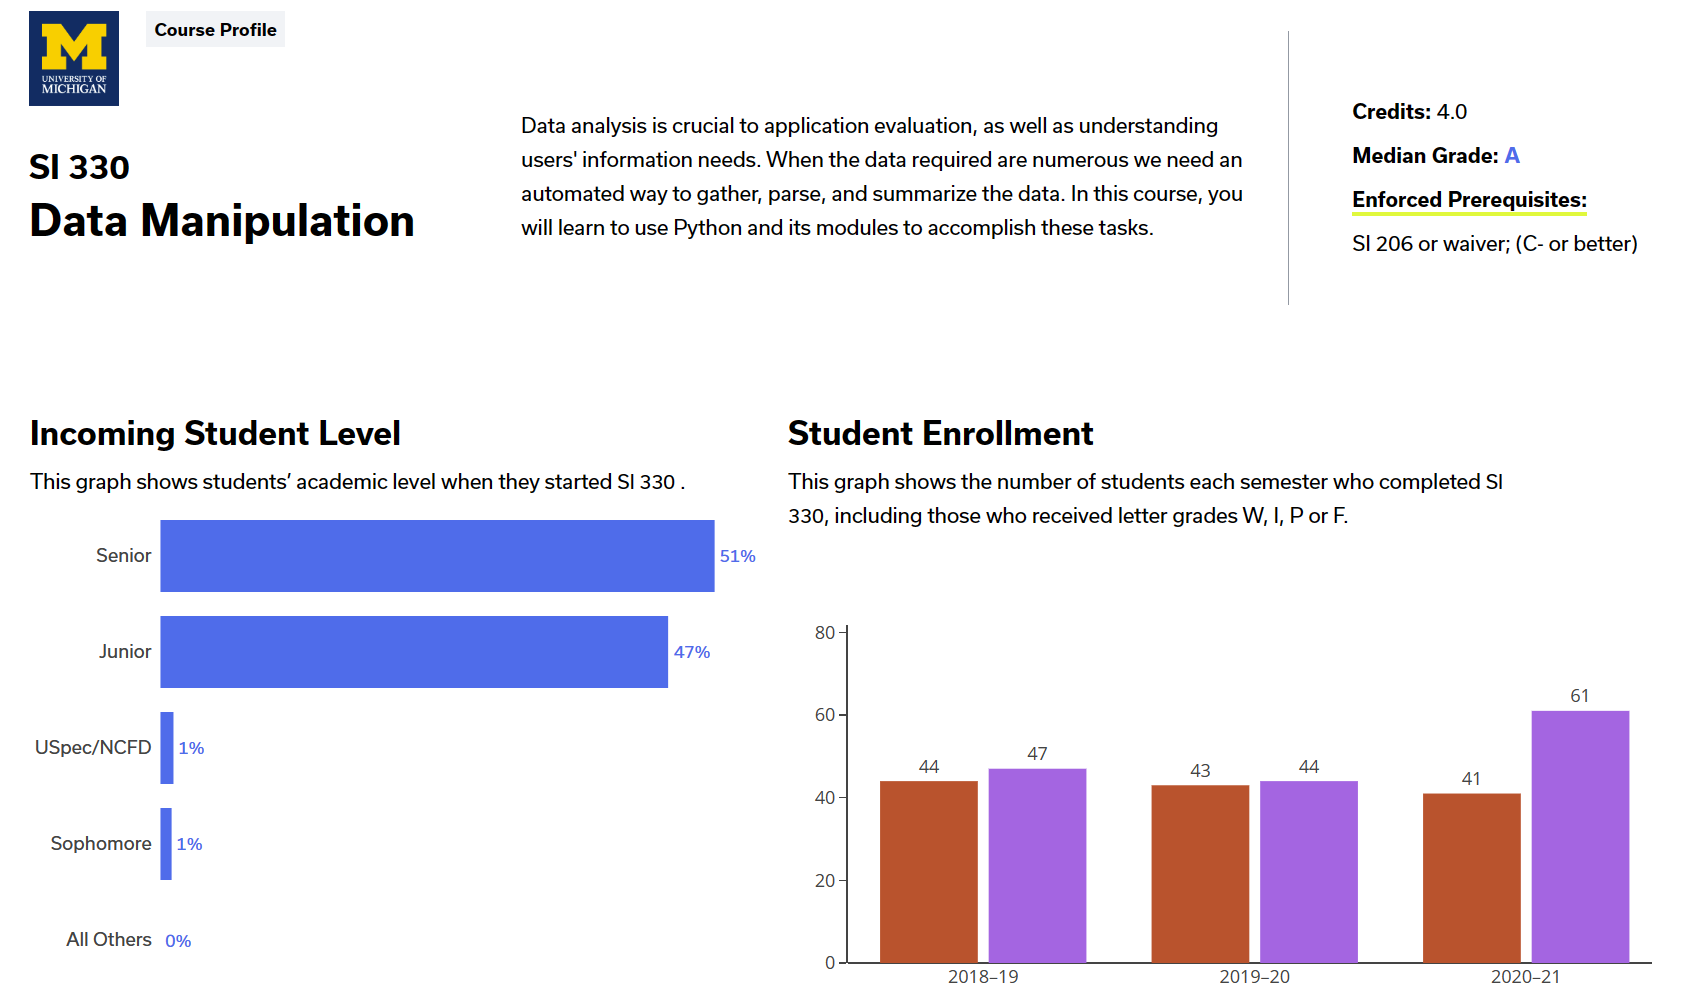
My very first experience teaching formally at a university also happened to occur during the peak of the pandemic, amid a number of other historic “firsts”. As a result, there was a lot of trial and error necessary (and in a very short time frame) as many things that worked for previous classes needed adjustments. Below, I briefly chronicle my experience as a graduate student instructor, and instructor of record for SI 330: Data Manipulation in Python.
Thinking About Thinking in the Wake of COVID-19
It’s been quite a while since I’ve updated this website (and blog), but I suppose there’s
no better excuse than a pandemic to find new hobbies and restart old projects. Since I first shared the educational materials on this site, I’ve (apparently) been grad school for over 2 years and, as part of my candidacy requirements, have the great burden opportunity to dig into an area of interest. I hope that the act of writing a blog post will help me organize my thoughts and inch closer to what it precisely is that I am interested in researching, and serve dual purpose as a time capsule of my personal and professional thoughts.
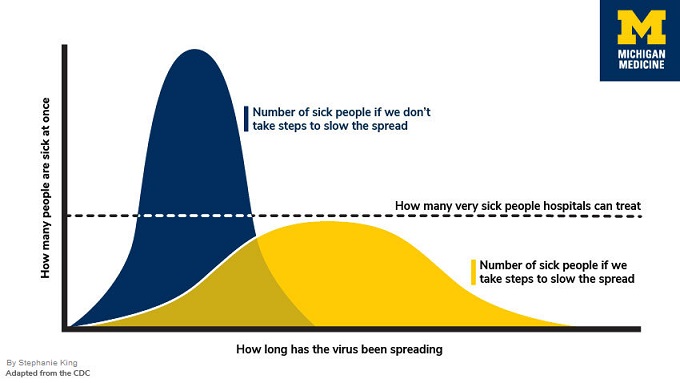
Now with that complete, I’ll move on to our main motivation: synthesizing knowledge regarding metacognition, in which the current pandemic will serve as a backdrop for this discussion about how people think and how we teach people to think. But, cognition and metacognition can (obviously) relate to many more things beyond what is discussed here. Roughly 3 months ago, when much of the lockdowns were first imposed, a friend and I were discussing the diagram below:
On the merits and follies of hand-written code
If you’ve been in a computer science class, you’re bound to hear someone complain about hand-written code during tests or quizzes at some point or another. Oftentimes, the debate goes something like this:
Oblivious Student: “This is so stupid and unrealistic. When will I ever have to hand-write code?”
Old-Fashioned Professor: “This is an important and fundamental skill–think about the job interviews!”
Fair enough. For instance, there are plenty of books and articles about technical interviews and this video to guide applicants towards those coveted tech positions:
Finding the perfect cup of coffee with gradient descent (part 2)
Last time, we introduced the coffee shop problem and a tool of the data analysis trade, that is gradient descent. This time, we’ll get into the meat of the analysis and finally reveal the winning price and recipe. As a result, there won’t be many interactive elements presenting big new concepts, but there will be plenty code snippets to complete. So without further ado, let’s begin.
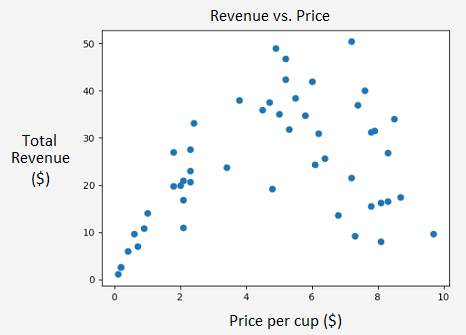
We know how to perform a linear regression, but how do we tackle interesting non-linear patterns like the one between price per cup and total revenue?
Markov music murder mystery
Previously, I talked about Bayesian statistics. This will be a continuation of that post, based on yet another topic I’ve tried to learn on my own. The only difference is that we’re spicing up the title with alliteration and switching up the theme: this post will be centered around Halloween, so get ready for some spooky music and literature (costumes are optional).
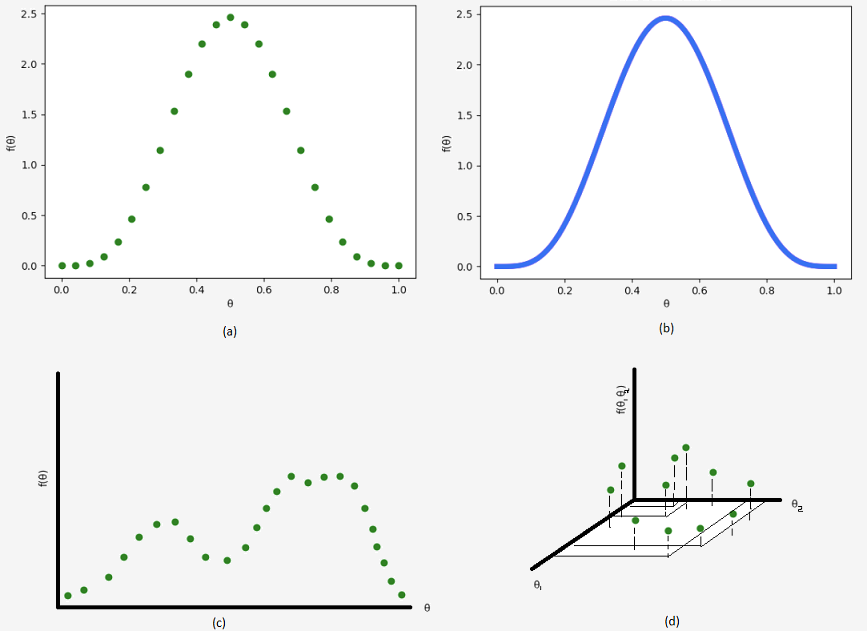
Recall that we worked really hard to show that a beta prior could account for a fair range of beliefs and had a nice analytical solution (i.e. it was possible to integrate that pesky denominator). Unfortunately, even with this discovery, you don’t have to get too creative to come up with situations that we can’t adequately describe. For instance, what if we have a bimodal distribution? That is, say there’s a class where you expect a cluster of A’s, a group of C’s, and not much else in between. A beta distribution certainly can’t capture this “double hump”. Fortunately, we have a solution. Take a look at \(\text{Beta}(5, 5)\) (figure b) below. Note that we can discretize and approximate this distribution using 25 points (figure a), or however many you’d like.
